ECVP 2024
Multimodal Person Evaluation: First Impressions from Faces, Voices, and First Names
Mila Mileva, University of Plymouth
Examples of the face images, voice recordings and first names used for the studies
Further information about rater agreement and gender differences in multimodal person first impressions
Details about how behavioural data was used to classify spontaneous descriptors
Further information about the most common descriptors used to describe first impressions of voices, their underlying structure, rater agreement and gender differences
Details about how computer learning was used to classify spontaneous descriptors
Further information about the most common descriptors used to describe first impressions of names, their underlying structure, rater agreement and gender differences
Stimulus examples
Voice Recordings
Human voices were collected from social media (e.g., YouTube). These were short (~1s) audio clips of people saying different greetings such as “Good morning!” or “Hello everyone!”. All audio clips were normalised for RMS amplitude using a PRAAT script and were saved in the uncompressed WAV format. The identities represented in this set varied in age and nationality, with all recordings in English.
Personal first names were some of the most common British names between 1904-2020. These were collected from the Office for National Statistics. The word cloud on the left shows some of the names used throughout the studies.
In order to extract the most commonly mentioned and distinct first impression categories, an independent sample of participants was presented with the top 150 descriptors of voices, names, and multimodal identities on an online interactive board. They were then asked to sort these descriptors into categories that describe a single concept. For example, descriptors such as clever, smart, bright, and stupid could be clustered together as they describe the same concept of intelligence.
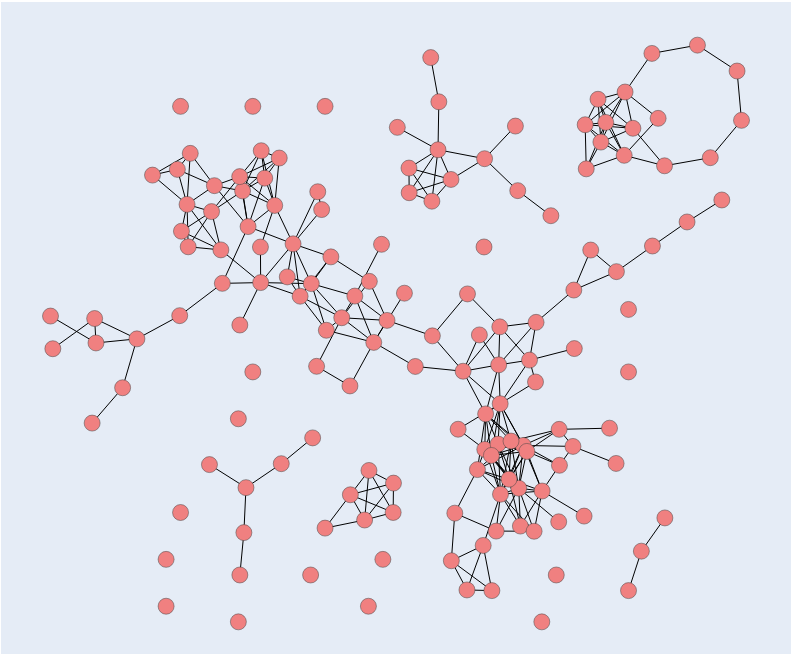
From these data, the proportion of participants who clustered every pair of descriptors was calculated. This provided an estimate of how closely the words in each pair were related to each other. An interactive map showing the relationship between each of these 150 descriptors was then created using Plotly in Python (see an example on the right). Use the buttons below to explore interactive maps created for spontaneours descriptors of voices, names and those from the multimodal condition, where participants had information about a person’s face, voice, and name, all at the same time. In these interactive plots, hovering on top of each point will reveal the trait it represents.
Computer classification

Free descriptors were also clustered based on word similarity. For this approach, the fastText library (Bojanowski et al., 2017) was used to generate vectors representing the meaning of each descriptor. This was done for the top 150 most commonly referred to descriptors for each stimulus type. These vectors were then analysed with Hierarchical Agglomerative Clustering using the linkage function in MATLAB. This produced distinct clusters of descriptors based on their average cosine similarity.
These clusters were visualised in a dendrogram. Use the buttons below to explore the dendrograms for spontaneous descriptors of voices, names and those from the multimodal condition, where participants had information about a person’s face, voice, and name, all at the same time.
Multimodal Analyses
Inter-Rater Agreement
High levels of agreement were seen for each trait, with Cronbach’s alpha between .667-.945. Agreement was also measured using Intraclass Correlation Coefficients (ICCs) – two-way random model with values for absolute agreement (see Figure on the right). Traits are ordered by agreement level.
Gender Differences
There were quite a few significant gender differences when participants were presented with information about the person’s face, voice and first name at the same time. Female identities were perceived as significantly more attractive, friendly, sociable, annoying, trustworthy, kind, easygoing, and posh than male identities. They were also perceived as significantly less assertive than male identities.
Voice-Based Analyses
Free Descriptors
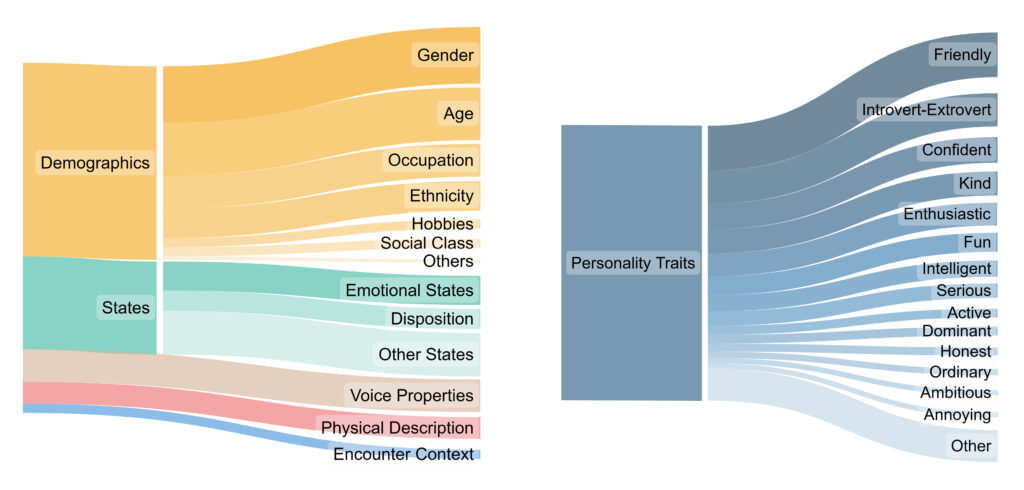
A total of 14,411 spontaneous descriptors were collected based on voice recordings of different greetings. The Sankey diagrams below show the most commonly mentioned categories of descriptors (left) as well as the most commonly used personality characteristics (right).
Underlying Structure
Exploratory Factor Analysis (EFA) revealed three underlying dimensions of voice evaluation. The first dimension captured evaluations of approachability, with high positive loadings from friendliness, sociability, fun, and kindness. It also reflected evaluations of extraversion (vs introversion) with high positive loadings from sociability and confidence and high negative loadings from shyness.
The second dimension captured judgements of ability or competence, with high positive loadings from evaluations of how hardworking or intelligent someone might be.
The final third dimension included high loadings from confidence and shyness (both of which had higher loadings on the first dimension) and from evaluations of authority (which was related to all three dimensions), perhaps reflecting evaluations of social dominance.
Surprisingly, attractiveness did not present with high loadings on any of the dimensions, implying that the traits included here were not related to the evaluation of attractiveness and that it might instead be an independent dimension.
Inter-Rater Agreement
High levels of agreement were seen for each trait, with Cronbach’s alpha between .756-.965. Agreement was also measured using Intraclass Correlation Coefficients (ICCs) – two-way random model with values for absolute agreement (see Figure on the right). Traits are ordered by agreement level.
Name-Based Analyses
Free Descriptors
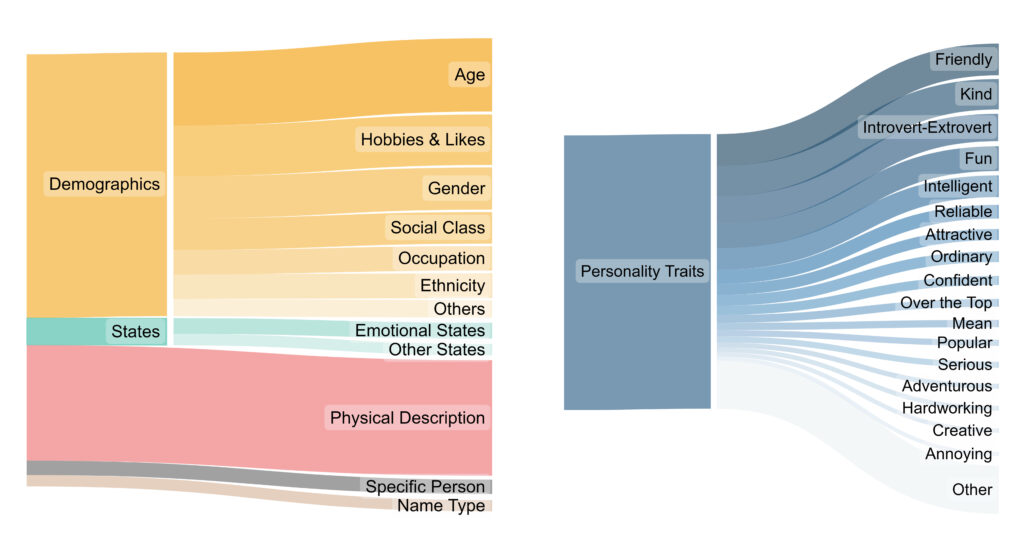
A total of 20,507 spontaneous descriptors were collected based on voice recordings of different greetings. The Sankey diagrams below show the most commonly mentioned categories of descriptors (left) as well as the most commonly used personality characteristics (right).
Underlying Structure
Exploratory Factor Analysis (EFA) revealed three underlying dimensions of personal name evaluation. The first name dimension captured evaluations of extraversion with high loadings from evaluations of how sociable, easygoing, fun, confident and shy someone might be.
The second dimension included high loadings from judgements of intelligence, work ethic, and social class. This second dimension seems to center around evaluations of how competent or reliable someone might be, which seems to be related to judgements of social class.
The final dimension had high loadings from kindness (which had stron loadings on all three dimensions) and shyness (which was more strongly related to the first dimension) and is therefore not reliable enough to be labelled in a meaningful way. Therefore, there seem to be two key judgements when we learn someone’s first name – how sociable and how competent they might be.
Inter-Rater Agreement
High levels of agreement were seen for each trait, with Cronbach’s alpha between .636-.927. Agreement was also measured using Intraclass Correlation Coefficients (ICCs) – two-way random model with values for absolute agreement (see Figure on the right). Traits are ordered by agreement level. The trait rude showed low levels of agreement, both in terms of Cronbach’s alpha (.506) and ICCs, therefore it was removed from subsequent analyses.


